Electrocardiography (ECG/EKG) Basics
Electrocardiography (ECG/EKG) Basics
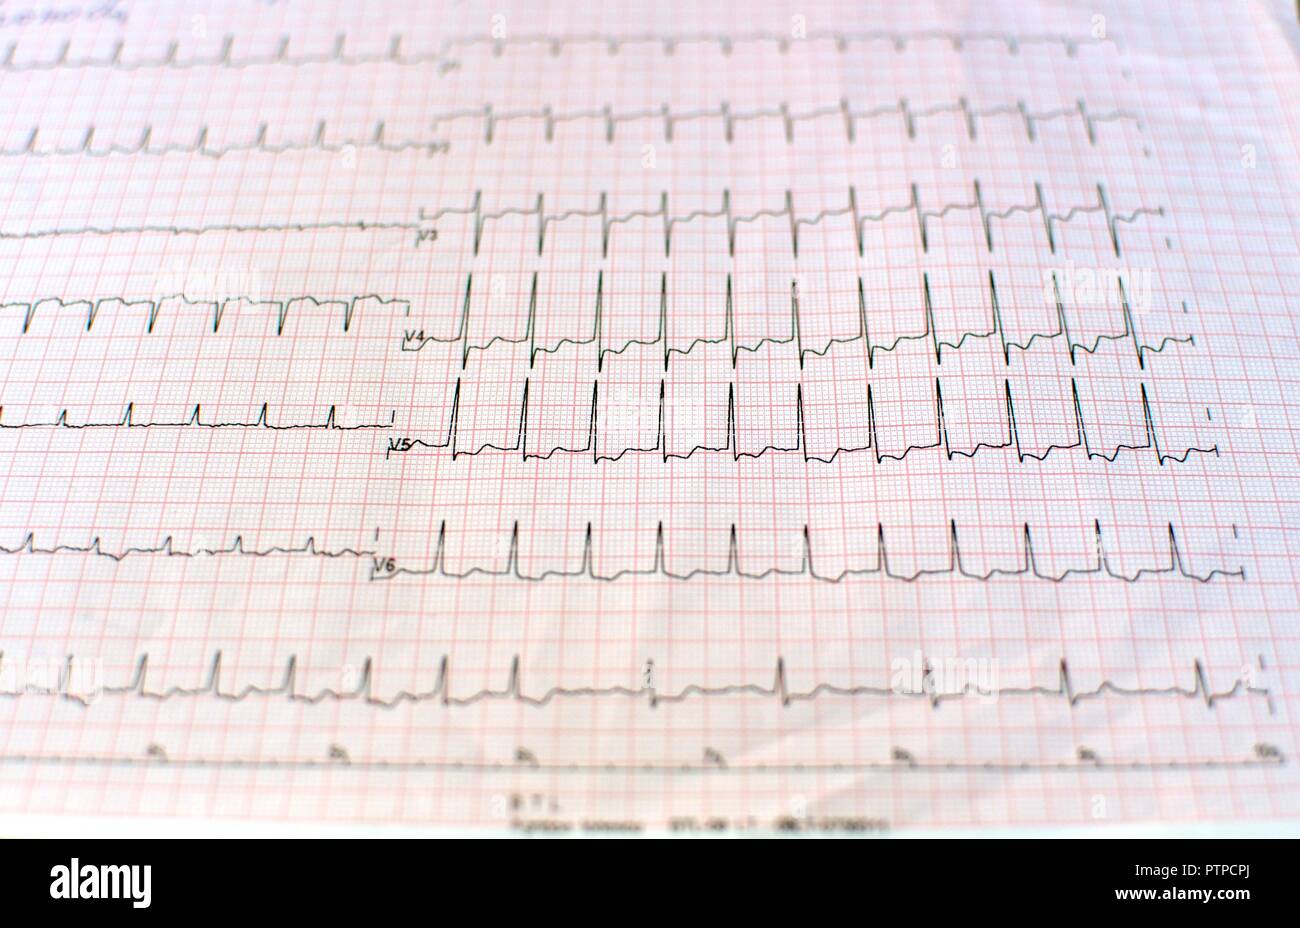
Objectives
- Understanding the basics of Electrocardiography (ECG/EKG)
- Basic interpretation of a 12-lead ECG
- Calculating Rate
- Analyzing Rhythm
- QRS Axis
- Anatomy and Normal Conduction Pathway
Anatomy and Normal Conduction
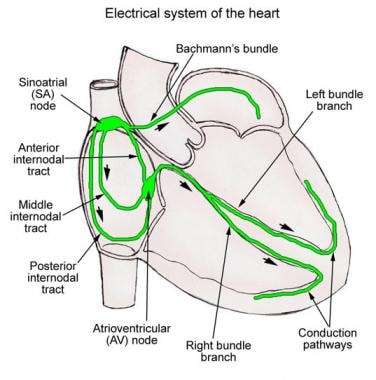
The heart's electrical conduction system is a network that helps maintain regular heartbeats. Here's a breakdown of the main components:
- SA Node (Sinoatrial Node): Often called the heart’s natural pacemaker, located in the right atrium. It initiates the electrical impulses.
- Atria: Both the right and left atria are part of the conduction pathway, allowing atrial depolarization.
- AV Node (Atrioventricular Node): Acts as an electrical relay station, slowing the electrical current before it is passed down to the ventricles.
- Bundle of His: A collection of heart muscle cells specialized for electrical conduction that transmits the electrical impulses from the AV node to the point of the apex of the fascicular branches.
- Right Bundle Branch: Conduction pathways that send electrical signals through the right ventricle.
- Left Anterior Fascicle: Part of the left bundle branch that transmits impulses to the anterior and superior parts of the left ventricle.
- Left Posterior Fascicle: Part of the left bundle branch that transmits impulses to the posterior and inferior parts of the left ventricle.
- Purkinje Fibers: Fibers that distribute the electrical impulse to the ventricles, causing them to contract.
Action Potential Phases

The electrical activity of the heart can be described in stages:
- Upstroke: Rapid depolarization due to Na+ influx.
- Early-fast Repolarization: Initial repolarization as Na+ channels close.
- Plateau: Calcium channels open allowing Ca2+ inflow, balancing the cell's charge.
- Repolarization: Ca2+ channels close and K+ exits the cell, returning the cell to its resting state.
- Diastole: Resting potential.
How Electrical Activity is Depicted on an ECG
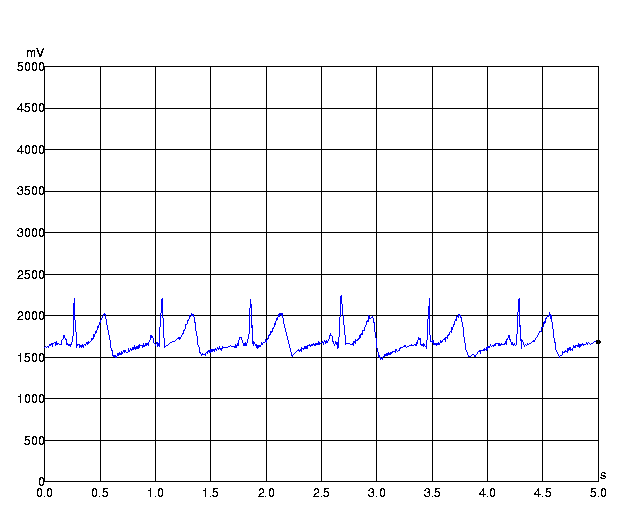
An ECG signal represents the sum of action potentials generated by millions of cardiomyocytes. Each signal has distinct strengths, travels in unique directions, and varies over time. The vector integrates magnitude and direction.
Vectors and ECG Waves:
- Toward Positive Pole of ECG Lead: Produces an upward deflection.
- Away From Positive Pole of ECG Lead: Produces a downward deflection.
Three Major Concepts:
- A unified sum of electrical activity in the heart over time can be depicted as a single electrical deflection (vector).
- Duration of activity is depicted on the x-axis as time.
- Intensity and angle of the vector are depicted on the y-axis (voltage).
Interpreting Waves and Segments
- P Wave: Atrial depolarization
- PR Interval: Time from the onset of atrial depolarization (P wave) to the onset of ventricular depolarization (QRS complex).
- PR Segment: End of atrial depolarization to the start of ventricular depolarization.
- QRS Complex: Ventricular depolarization
- ST Segment: Initial phase of ventricular repolarization.
- T Wave: Rapid phase of ventricular repolarization
- U Wave: Small positive deflection after the T wave, of uncertain origin, possibly delayed repolarization of Purkinje cells.
Calculating the Heart Rate (Rate Calculation)
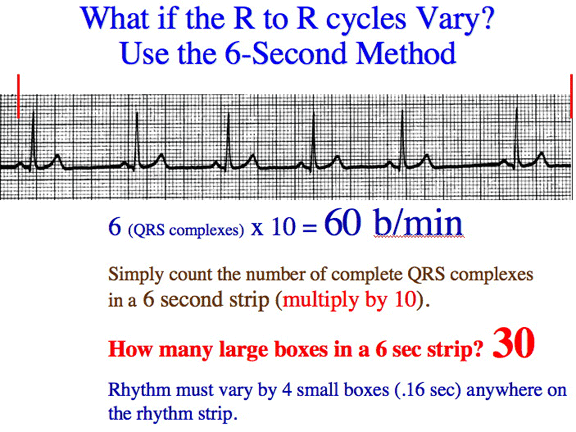
- Determine if the rate is regular or irregular.
- Use one of the three methods to calculate the rate:
- Count Boxes and Divide: 300 divided by the number of large boxes between QRS complexes.
- Count-off Method: Memorize the sequence 300-150-100-75-60-50 and use it based on the number of large boxes.
- Count beats in a time frame: Count the number of beats in 6 seconds and multiply by 10 (good for irregular rates).
Practice Calculations:
- Example Rate Calculation: 300/4 = 75 bpm
Method for Reading an ECG
- Rate: Is it within normal range (60-100 bpm)?
- Rhythm: Is there a P wave before every QRS? Are the PR intervals consistent?
- Axis: Examine the QRS axis.
Sinus Rhythms
- Normal Sinus Rhythm: P wave before every QRS and consistent PR intervals.
- Sinus Tachycardia: Sinus rhythm with a rate greater than 100 bpm.
- Sinus Bradycardia: Sinus rhythm with a rate of less than 60 bpm.
Axis Deviation
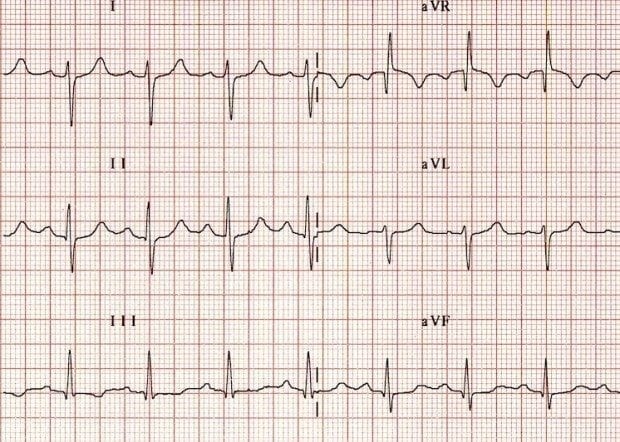
- Right Axis Deviation (RAD): Right ventricle hypertrophy or left ventricular infarction.
- Left Axis Deviation (LAD): Left ventricle hypertrophy or inferior myocardial infarction.
- Normal Axis: Between -30 and +90 degrees.
Using Lead I and aVF to Determine Axis:
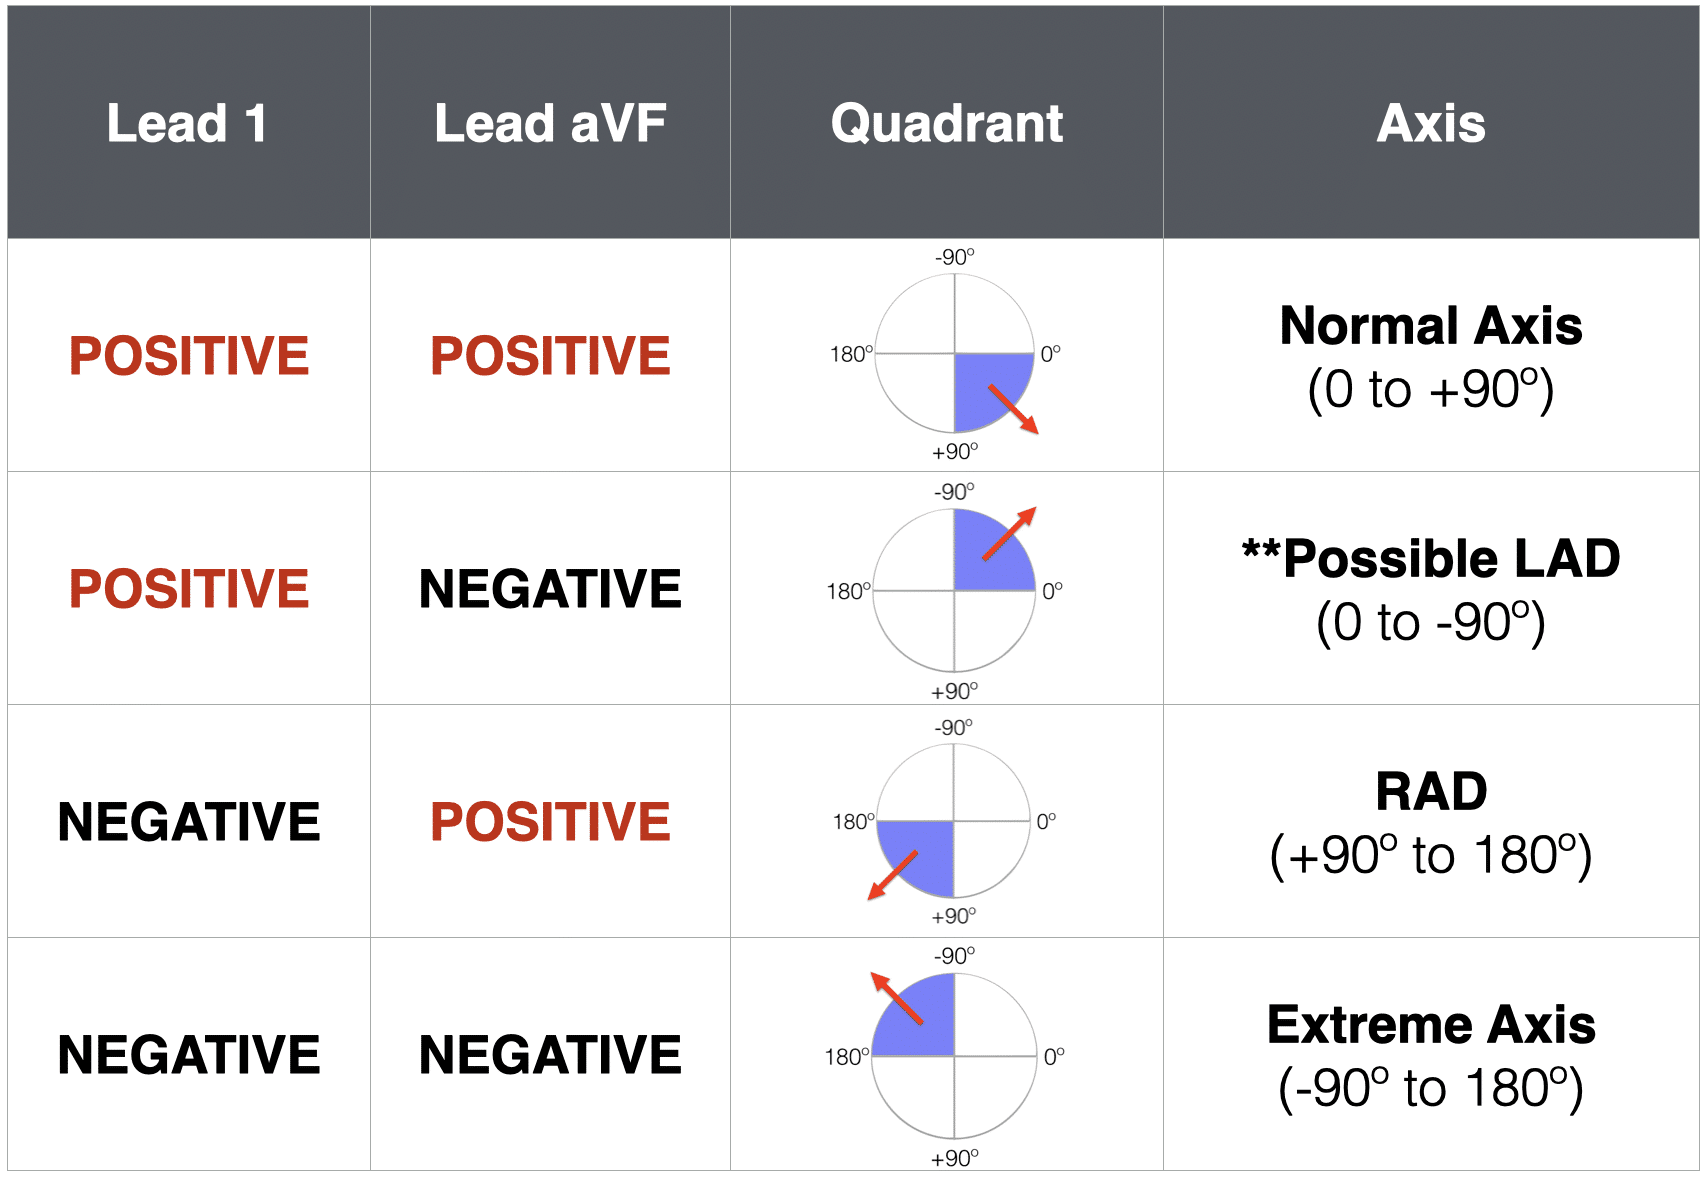
- Positive in Lead I and aVF: Normal Axis.
- Positive in Lead I and negative in aVF: Left Axis Deviation.
- Negative in Lead I and aVF: Extreme Right Axis.
- Negative in Lead I but positive in aVF: Right Axis Deviation.
Practice the Axis Determination:
- Example: Positive in Lead I, Positive in aVF = Normal Axis
Review and Practice
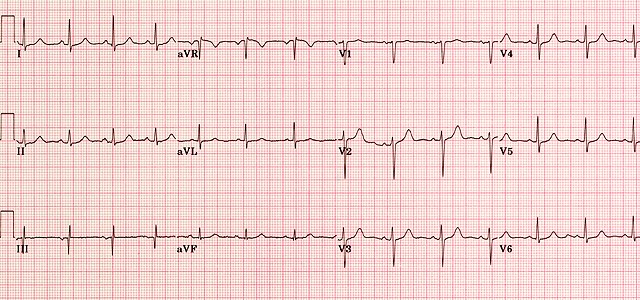
- Practice Analyzing Rhythms and Axes: Use sample ECG tracings to identify rates, rhythms, and axis deviations.
ECG:
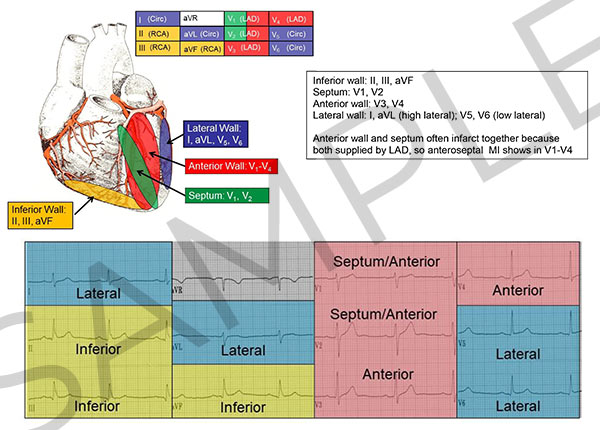
Cardiac Axis Interpretation: